Graphy: In Studio
A screenshot gallery; click on a picture to enlarge it.
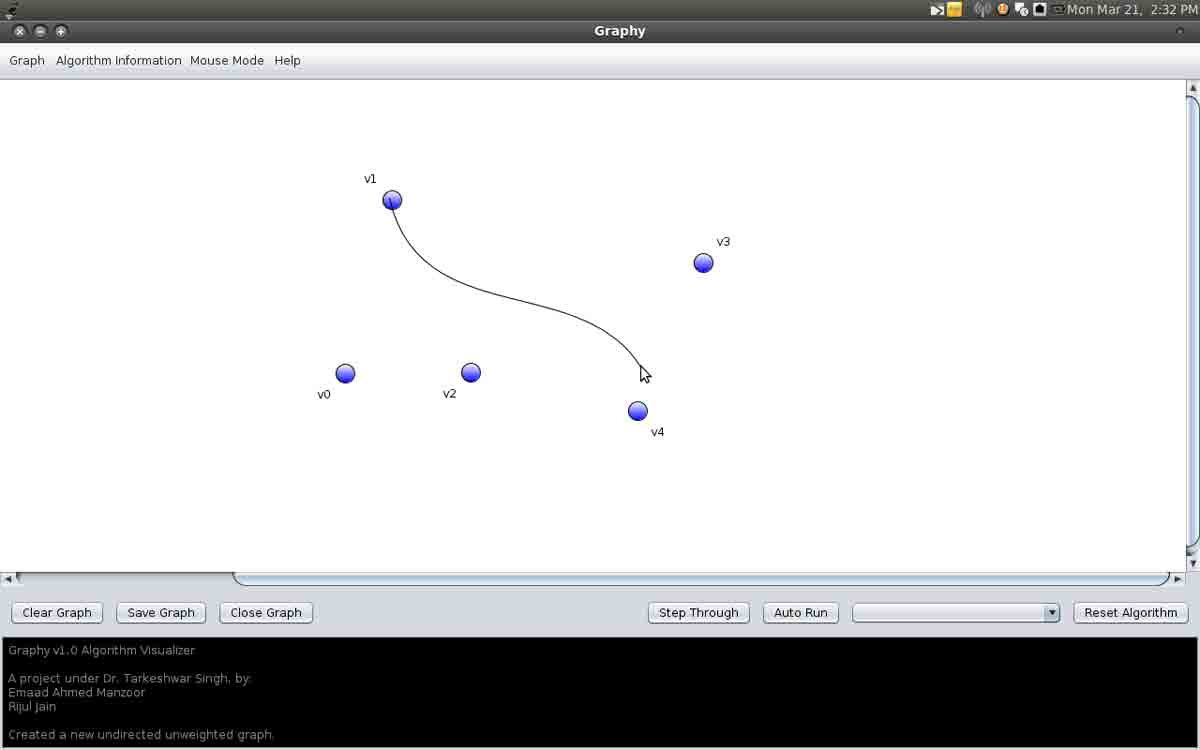
Figure 1: Constructing a graph: graphs can be directed or undirected, and can be simple or hyper-graphs (with self-loops). Once a graph type has been selected, construction involves simply selecting an element type (vertex or edge) and clicking/dragging to create it.
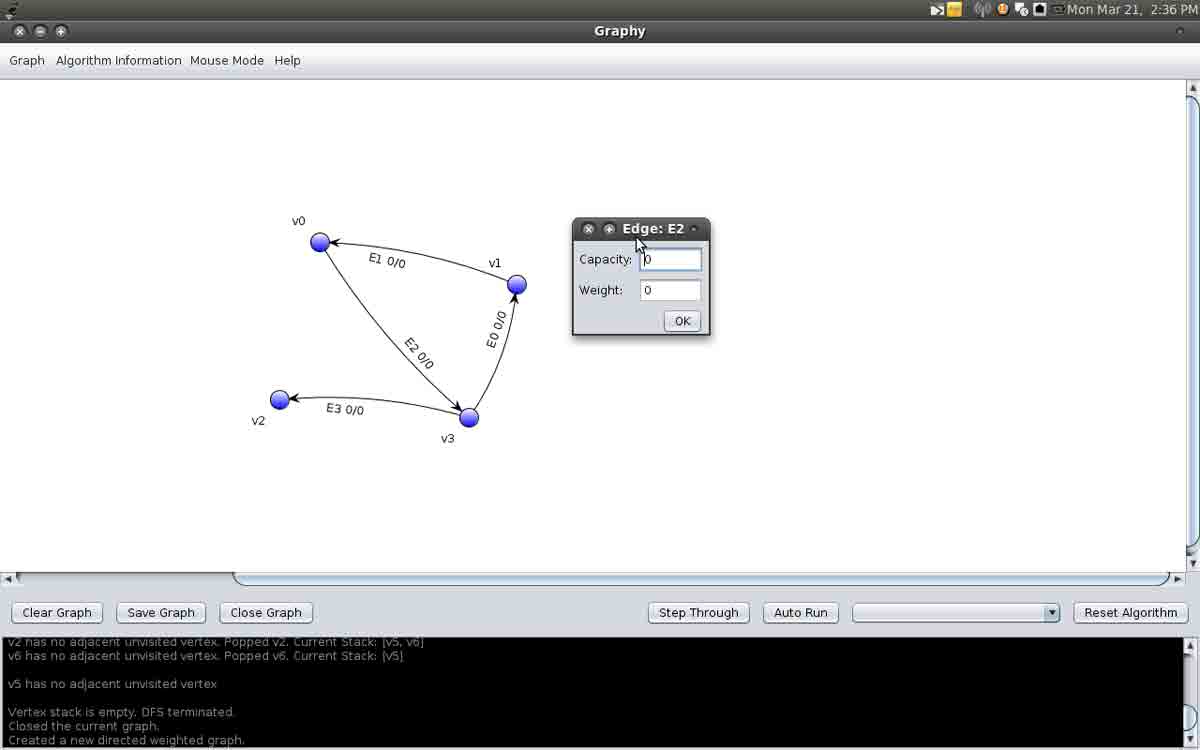
Figure 2: Setting edge weights and capacities: right-clicking an edge brings up a menu allowing one to set edge weights and capacities (in the case of maximum flow algorithms). These are displayed above the edge in the weight/capacity format.
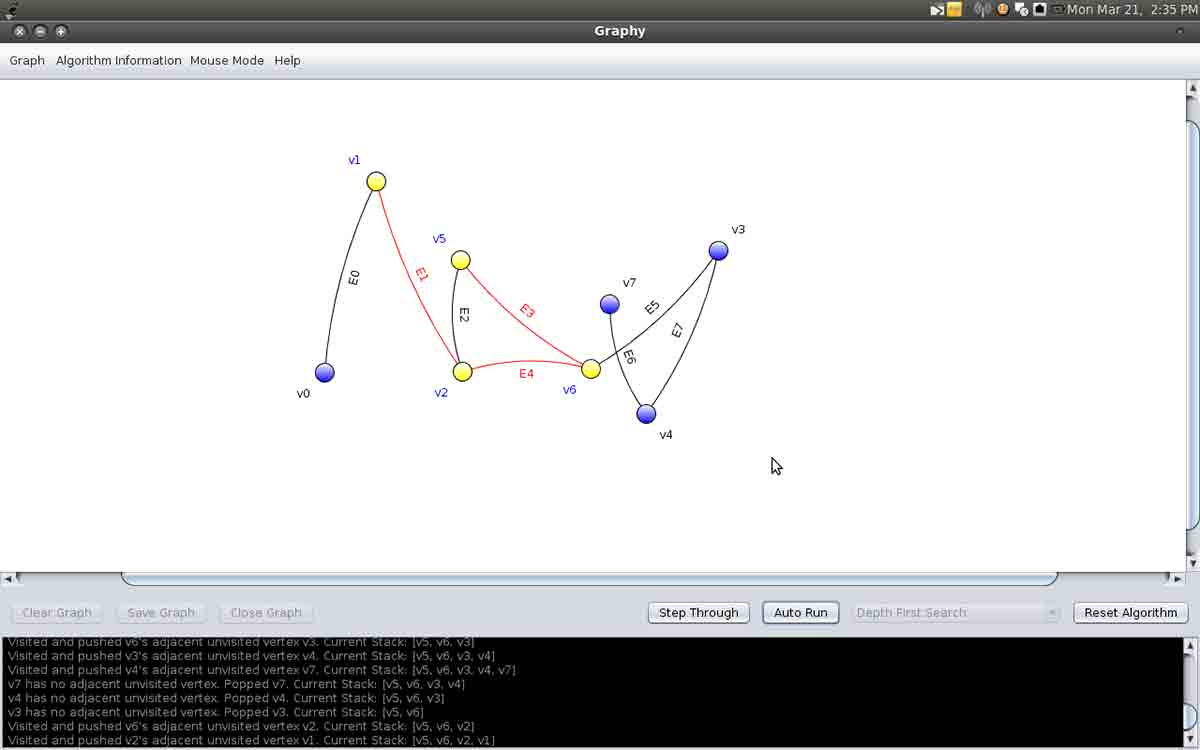
Figure 3: Running a depth-first search: algorithms can be visualized by first selecting one from the drop-down menu and then using the step controls below the graph drawing pane. Verbose information about the algorithm, like the data structure contents, is displayed in the console panel at the bottom of the window.
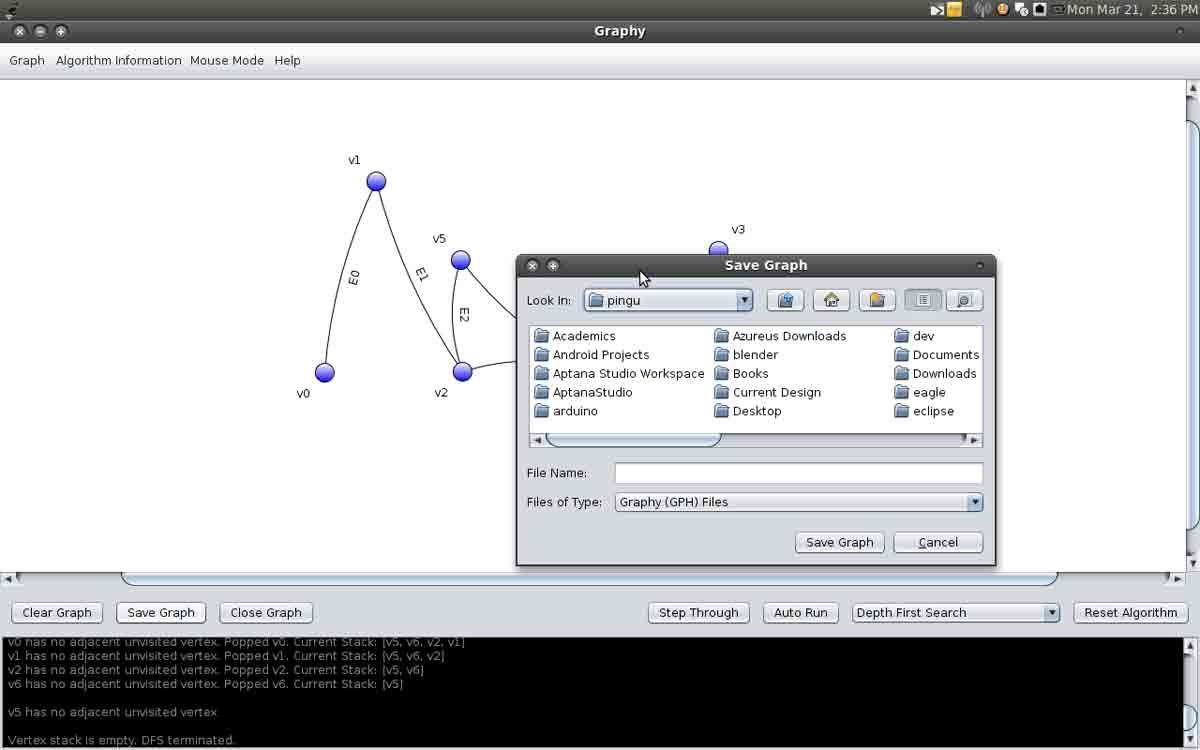
Figure 4: Saving a graph To GraphML: GraphML is a portable XML-based format to store a graph as a flat text file. GraphML files can be transferred across machines, and later be opened in Graphy and continued to be edited as usual.
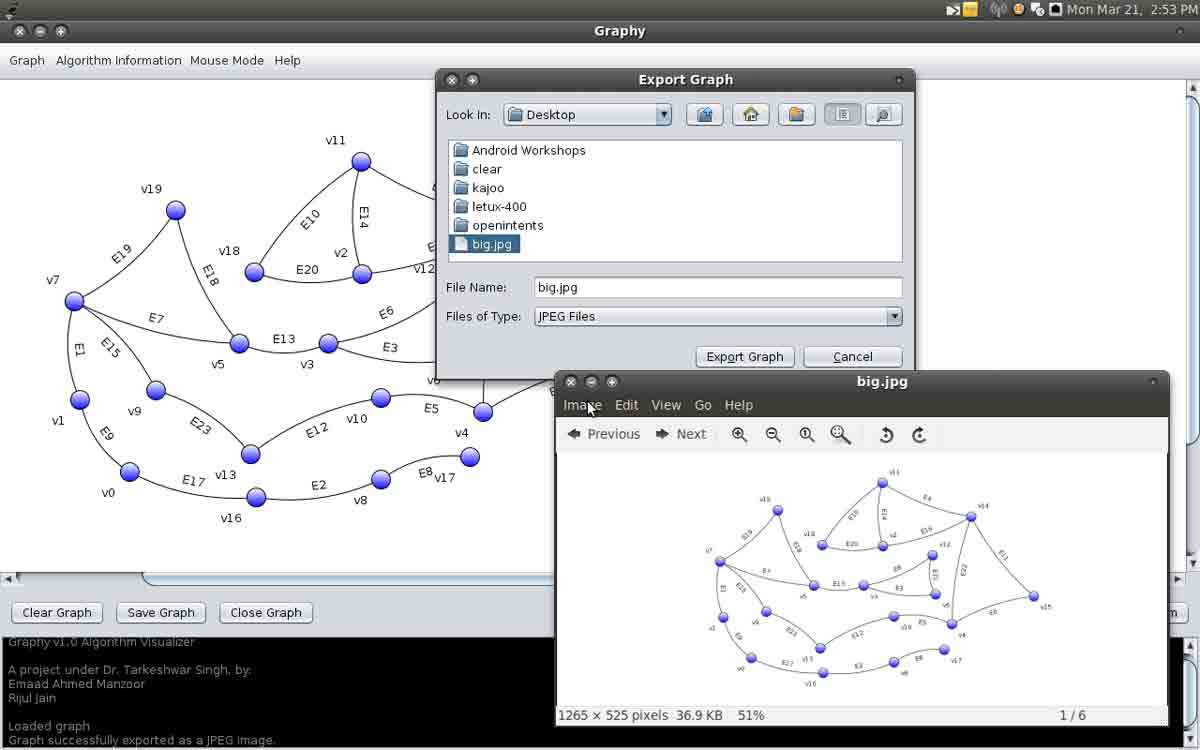
Figure 5: Exporting a graph as an image: Graphy supports exporting graphs as JPG (a colour bitmap format) or EPS (a vector monochrome format).

